Introduction: Why Software Performance Monitoring is Critical
Application downtime carries a staggering price tag. According to the ITIC 2024 Hourly Cost of Downtime Survey, 90% of enterprises now face downtime costs exceeding $300,000 per hour, with the average per-minute impact reaching approximately $14,056. For large enterprises in sectors like finance, a single hour of disruption can cost up to $5 million.
Software performance monitoring has evolved from a nice-to-have to a business-critical practice. Beyond preventing revenue loss, it keeps applications reliable, users satisfied, and operations running smoothly.
For industrial automation systems—where management software controls everything from material handling to production tracking—monitoring becomes even more critical. A single system failure can halt entire production lines.
This guide covers the essential elements of performance monitoring: key metrics, implementation best practices, common pitfalls, and practical guidance for selecting the right solution.
TLDR:
- Downtime costs enterprises $300,000+ per hour on average
- Track response time, error rates, throughput, and resource utilization as foundational metrics
- Establish baselines before setting alert thresholds to avoid alert fatigue
- Integrate monitoring into CI/CD pipelines for early regression detection
- Choose tools matching your tech stack, budget, and integration needs
What is Software Performance Monitoring?
Software performance monitoring is the continuous observation and analysis of application behavior, resource utilization, and user experience metrics.
It provides visibility into how applications perform under real-world conditions, enabling teams to detect issues before they impact users and optimize system performance ahead of time.
Beyond Basic Uptime Checks
Performance monitoring differs fundamentally from simple uptime monitoring by tracking detailed metrics that reveal how well an application functions, not just whether it's accessible. While uptime monitoring answers "Is the system running?", performance monitoring answers "Is the system delivering acceptable experiences?"
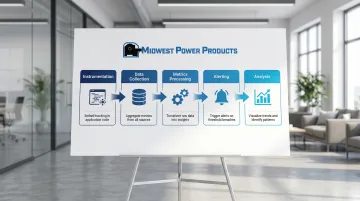
Core components include:
- Instrumentation - Code embedded in applications to collect performance data
- Data collection - Continuous gathering of metrics from multiple system layers
- Metrics processing - Converting raw data into actionable insights
- Alerting - Automated notifications when performance degrades
- Analysis - Tools for identifying patterns, trends, and root causes
These components work together across three primary monitoring approaches.
Monitoring Approaches
Real User Monitoring (RUM):
- Captures actual user interactions with response times and errors
- Reveals what customers experience across different devices and networks
- Shows "last mile" performance in real-world conditions
Synthetic Monitoring:
- Uses scripted simulations to test critical user journeys
- Runs automated tests continuously before users encounter issues
- Establishes performance baselines for comparison
Infrastructure Monitoring:
- Tracks health of servers, containers, databases, and networks
- Identifies resource constraints affecting applications
- Provides foundation-level system visibility
Performance Monitoring in the Broader Ecosystem
Modern performance monitoring fits within observability practices that unify three data types: metrics (measurements over time), logs (event records), and traces (request paths through distributed systems).
This integration supports DevOps workflows by enabling rapid feedback loops, early testing, and continuous performance validation throughout the development lifecycle.
Why Software Performance Monitoring Matters
Performance directly impacts your bottom line. Google's research shows that 53% of mobile site visits are abandoned when pages take longer than 3 seconds to load.
The numbers get worse fast. As load time increases from 1 to 3 seconds, bounce probability jumps 32%. At 5 seconds, it increases 90%.
Revenue Impact
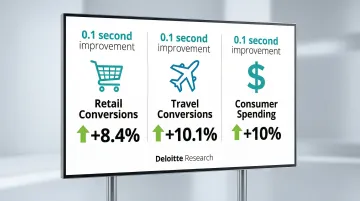
Deloitte research found that a 0.1-second improvement in site speed drives measurable business results:
- Retail conversion rates increased by 8.4%
- Travel site conversions jumped 10.1%
- Retail consumers spent nearly 10% more
These aren't marginal gains—millisecond improvements translate directly to revenue growth.
Operational Efficiency
Beyond revenue, monitoring reduces the time teams spend firefighting. The USDA Forest Service reduced Mean Time To Resolution (MTTR) by 60%—from 50 minutes to 20 minutes—and improved Mean Time To Detect (MTTD) by 85% after implementing unified observability. Advanced APM tools with AI-driven root cause analysis can reduce MTTR by 90% or more by pinpointing exact code lines or database queries causing issues.
Proactive Problem Prevention
Monitoring shifts teams from reactive to proactive. By establishing baselines and tracking deviations, you catch degradation patterns before they cascade into outages.
This approach delivers three key benefits:
- Reduces customer-facing incidents through early detection
- Improves developer productivity by eliminating emergency response cycles
- Preserves engineering resources for feature development instead of firefighting
Modern APM solutions deliver immediate notifications when application performance deviates from expected baselines, enabling rapid response before minor issues escalate.
Key Metrics to Track in Software Performance Monitoring
Effective monitoring requires tracking specific metrics that reveal system health and user experience. Google's Site Reliability Engineering practices recommend focusing on the "Four Golden Signals": latency, traffic, errors, and saturation.
Response Time and Latency
Response time measures the duration from user request to complete response. It's the most direct indicator of user experience quality.
A 200ms average response time might hide the fact that 5% of users wait 3+ seconds. Google SRE recommends measuring tail latency using percentiles—p50 (median), p95, and p99. The p99 latency reveals the experience of your slowest 1% of requests, often indicating systemic issues.
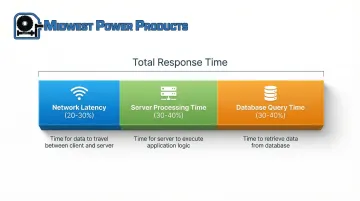
Latency breaks down into three components:
- Network latency - Time for data to travel between client and server
- Server processing time - Application logic execution duration
- Database query time - Data retrieval and manipulation duration
For acceptable performance, interactive applications typically target sub-200ms response times for an "instant" feel, though specific targets depend on user expectations and application type.
Error Rates and Exceptions
Error rate represents the percentage of failed requests over a specific period. It directly indicates reliability from the user perspective.
Errors fall into three main categories:
- Client-side errors (4xx) - Invalid requests, authentication failures, missing resources
- Server-side errors (5xx) - Application crashes, database failures, timeout errors
- Application-level exceptions - Unhandled errors that may not generate HTTP error codes
Track error latency separately from successful request latency. Failed requests often complete faster than successful ones, which can skew your performance data.
Set threshold alerts when error rates exceed acceptable levels—typically >1% of requests warrants investigation.
Throughput and Request Volume
Throughput measures the number of requests or transactions processed per unit of time, typically expressed as requests per second (RPS) or queries per second (QPS).
Monitoring request volume helps identify:
- Traffic patterns and peak usage periods
- Capacity limitations before they cause failures
- Anomalous behavior indicating attacks or system issues
- The relationship between load and resource consumption
Resource Utilization
Resource monitoring tracks CPU usage, memory consumption, disk I/O, and network bandwidth to identify bottlenecks before they degrade performance.
Most systems degrade before reaching 100% utilization. Latency increases often signal resource saturation early. A system running at 85% CPU might already be experiencing performance degradation during traffic spikes.
Tracking utilization trends over time supports infrastructure scaling decisions, helping you add capacity proactively rather than reactively during outages.
Availability and Uptime
Resource metrics connect directly to availability—the percentage of time an application is accessible and functional. Availability typically appears in "nines":
- 99.9% (three nines) = ~8.76 hours downtime per year
- 99.99% (four nines) = ~52.6 minutes downtime per year
- 99.999% (five nines) = ~5.26 minutes downtime per year
Monitor availability across different geographic regions and user segments to ensure consistent experience. A service might be available in one region while failing in another due to regional infrastructure issues.
Apdex Score
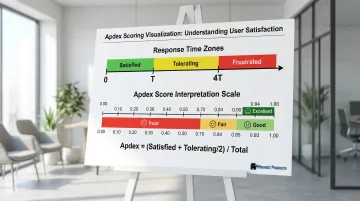
The Application Performance Index (Apdex) measures user satisfaction based on response times using a standardized 0-1 scale.
Apdex categorizes experiences based on a target threshold (T):
- Satisfied: Response time ≤ T
- Tolerating: Response time > T and ≤ 4T
- Frustrated: Response time > 4T or failed
The formula: Apdex = (Satisfied Count + Tolerating Count/2) / Total Samples
Score interpretation:
- 0.94-1.00 = Excellent
- 0.85-0.93 = Good
- 0.70-0.84 = Fair
- <0.70 = Poor
Set your T threshold based on user expectations. The default 4-second threshold may be too generous for interactive applications but appropriate for batch processes.
Best Practices for Implementing Software Performance Monitoring
Start with Clear Objectives and SLAs
Define what "good performance" means for your specific application before implementing monitoring tools. Generic thresholds rarely align with actual user expectations or business requirements.
Establish Service Level Indicators (SLIs): These are quantitative measures of service level, such as request latency or error rate. Choose SLIs that directly reflect user experience.
Set Service Level Objectives (SLOs): These are target values for SLIs—for example, "99% of requests complete in <100ms." Google SRE guidance recommends starting with what users actually care about rather than what's currently achievable.
Keep SLOs simple and limited in number to ensure they remain actionable.
Align monitoring objectives with business outcomes. If cart abandonment is a concern, prioritize checkout flow performance metrics over less critical page load times.
Implement Comprehensive Instrumentation
Monitor all critical application components to gain complete visibility:
- Frontend (browser performance, JavaScript errors)
- Backend services (API response times, service dependencies)
- Databases (query performance, connection pooling)
- Third-party services (external API latency, failure rates)
Use a combination of approaches:
- Agent-based monitoring for deep application insights with minimal code changes
- Agentless monitoring for environments where agents can't be installed
- Custom instrumentation for business-critical transactions unique to your application
Add custom tracking for custom workflows that matter to your business. Generic monitoring captures standard HTTP requests, but you need custom instrumentation to track multi-step processes like order fulfillment or account creation.
Establish Baseline Performance Metrics
Collect historical data to understand normal application behavior before setting alert thresholds. Without baselines, you can't distinguish between normal variations and genuine performance issues.
Observation period: Monitor your application under typical load conditions for 2-4 weeks to capture traffic seasonality, including weekday/weekend patterns and time-of-day variations.
Once established, baselines enable automated detection of deviations that warrant investigation. A 200ms response time might be excellent for one endpoint but indicate serious degradation for another.
Configure Intelligent Alerting
With baselines established, you can configure alerts that respond to genuine issues. Poor alerting strategies create two problems: missing critical issues or drowning teams in noise that leads to alert fatigue.
Balance sensitivity with specificity. Trigger alerts for genuine issues requiring action, not normal variations. Use percentile-based thresholds (p95, p99) rather than averages to catch outliers affecting user experience.
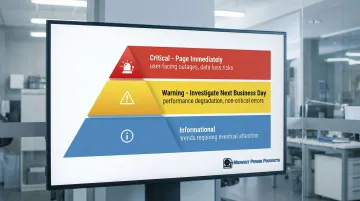
Categorize alerts by severity and business impact:
- Critical (page immediately): User-facing outages, data loss risks
- Warning (investigate next business day): Performance degradation, non-critical errors
- Informational: Trends requiring eventual attention
Instead of alerting on every spike, trigger alerts only when error budgets are consumed at dangerous rates. For example, 2% budget consumption in 1 hour suggests you'll exhaust your monthly budget in two days.
Implement Distributed Tracing
Microservices architectures require distributed tracing. It follows individual requests across multiple services and components, revealing bottlenecks in complex transaction flows.
Each request receives a unique correlation ID that's passed through every service it touches. Tracing tools collect timing data at each hop, building a complete picture of the request journey.
Key implementation considerations:
- Use OpenTelemetry, the emerging vendor-neutral standard for instrumentation
- Prevents vendor lock-in and simplifies tool migration
- Apply sampling strategies to manage data volumes
- Tail-based sampling retains only interesting traces (errors, high latency)
Recording 100% of traces creates massive data volumes. Strategic sampling balances visibility with cost.
Integrate Monitoring into Development Workflows
Incorporate performance monitoring earlier in development by building it into CI/CD pipelines. This catches regressions before they reach production.
Configure pipelines to automatically fail builds when performance regresses beyond acceptable thresholds—for example, if latency exceeds baseline by >10%.
Run automated performance tests in staging environments that simulate real user journeys. This validates performance before release.
Provide development teams with access to monitoring data during coding and testing. When developers see performance impacts immediately, they write more efficient code and catch issues earlier.
Common Pitfalls to Avoid in Performance Monitoring
Monitoring Without Clear Objectives
Data overload happens when you track hundreds of metrics without defined goals. Teams drowning in dashboards can't identify actionable insights when every data point seems equally important.
Focus on metrics that directly indicate user experience or business impact. For industrial automation systems, this means prioritizing production throughput and system response times over vanity metrics.
Setting Alert Thresholds Too High or Too Low
Alert threshold extremes create problems at both ends. Overly aggressive thresholds trigger constant false alarms, leading to alert fatigue where teams ignore notifications.
Conversely, overly permissive thresholds let genuine issues go undetected until customers complain. Balance sensitivity with your team's capacity to respond—alerts should be actionable, not overwhelming.
Focusing Only on Infrastructure Metrics
Infrastructure-only monitoring misses actual user impact. You might have healthy servers while users experience terrible performance due to frontend issues, third-party service failures, or network problems.
Always monitor end-user experience alongside infrastructure metrics. This dual approach reveals problems that pure server monitoring would miss.
Choosing the Right Monitoring Solution for Your Organization
Selection Criteria
Technology compatibility: Ensure the solution supports your programming languages, frameworks, and infrastructure. A tool with excellent Node.js support won't help if you run primarily .NET applications.
Implementation complexity: Evaluate setup effort, learning curve, and ongoing maintenance requirements. Some solutions require extensive configuration while others provide automatic instrumentation.
Scalability: Check whether the solution can handle your current transaction volumes and future growth without performance degradation or cost explosion.
Cost Considerations
Pricing models vary significantly across vendors. Understanding these structures helps you forecast actual costs as your monitoring needs scale.
Per-host pricing (most common):
- Datadog: Starts at $31 per host/month
- Dynatrace: $58 per host/month for 8 GiB hosts
- Splunk Observability: $60 per host/month
Usage-based pricing:
- New Relic: $0.40 per GB ingested plus user seats (~$49/month for core users)
Session/transaction pricing:
- RUM typically costs ~$1.50 per 1,000 sessions
- Serverless monitoring priced per invocation or trace
Beyond licensing fees, factor in total cost of ownership:
- Infrastructure requirements (on-premises solutions)
- Training and onboarding time
- Ongoing support and maintenance
Integration Capabilities
Beyond cost, consider how well solutions integrate with your existing ecosystem:
- CI/CD platforms: Jenkins, GitHub Actions, GitLab, Azure DevOps
- Incident management: PagerDuty, ServiceNow, Opsgenie
- Collaboration tools: Slack, Microsoft Teams, Jira
Leading platforms like Datadog, New Relic, and Dynatrace offer extensive integration libraries. AWS CloudWatch provides native integration with AWS services. Open-source options like Prometheus and Grafana offer flexibility through community-developed integrations.
Analytics and Visualization
Strong analytics capabilities separate good tools from great ones. Look for platforms that transform raw metrics into actionable insights:
- Customizable dashboards for different audiences (executives, developers, operations)
- AI-driven root cause analysis that automatically identifies issue sources
- Automated baselining that learns normal behavior patterns
- Query languages for ad-hoc analysis and custom reports
Remote Monitoring Capabilities
Modern monitoring solutions provide access from anywhere, enabling distributed teams to maintain visibility regardless of location. Leading APM solutions deliver comprehensive monitoring through web interfaces and mobile apps, ensuring teams can respond to issues 24/7 from any location.
Frequently Asked Questions
What is an APM in software?
Application Performance Monitoring (APM) tracks software application performance, availability, and user experience through automated tools. It provides visibility across application components, enabling teams to detect and resolve performance issues before they impact users.
How do you measure software performance?
Software performance is measured through key metrics including response time, throughput, error rates, resource utilization (CPU, memory, disk, network), and user satisfaction scores like Apdex. These metrics are collected via monitoring tools that track application behavior in real time.
What is the difference between APM and SRE?
APM refers to tools and practices for monitoring application performance. SRE (Site Reliability Engineering) is a broader discipline applying software engineering principles to operations. SRE teams use APM as one component alongside error budgets, SLOs, and automation.
What is the best software performance monitoring tool?
The best tool depends on your application architecture, technology stack, budget, and team expertise. Popular options include Datadog, New Relic, and Dynatrace for full-featured SaaS monitoring, AWS CloudWatch for AWS workloads, and open-source solutions like Prometheus and Grafana.
How much does performance monitoring cost?
Costs vary based on deployment model, monitored hosts, data retention, and feature sets. Typical SaaS solutions range from $30-$60 per host per month, while usage-based models charge around $0.40 per GB of data ingested.
What metrics should I monitor first when starting with performance monitoring?
Prioritize user-facing metrics first: response time, error rates, and availability. These directly indicate user experience quality. Next, add resource utilization metrics (CPU, memory) to identify infrastructure constraints. Finally, expand to transaction-specific metrics based on your application's critical paths and business-important workflows.