Introduction
Most plant managers in textile services know the feeling: you're reviewing the end-of-shift report and discovering a tunnel washer ran at reduced throughput for three hours — and nobody flagged it. The problem wasn't hidden. It just wasn't visible until it was too late to do anything about it.
Manual logs, paper-based records, and siloed department reports create an unavoidable information gap between when something happens and when management learns about it. McKinsey's Industry 4.0 analysis found that many manufacturers — particularly smaller and mid-sized operations — still rely on pen, paper, or basic spreadsheets for performance data collection. That's the exact gap factory monitoring systems are built to close.
This article covers what factory monitoring is, what it tracks, the benefits it delivers, and the KPIs plant managers should be watching across their operations.
Key Takeaways:
- Factory monitoring replaces end-of-shift guesswork with live production data
- Effective systems track equipment, process parameters, output, downtime causes, and resource use
- Purpose-built platforms connect directly to existing wash aisle, chemical, and sorting systems
- OEE, downtime rate, throughput attainment, and quality yield are the metrics that matter most
- Remote and multi-site access lets operations directors oversee multiple facilities from one view
What Is a Factory Monitoring System?
A factory monitoring system is a technology platform that continuously collects, analyzes, and displays data from equipment, production lines, and operational processes — giving managers a live, accurate picture of plant performance at any given moment.
That's a fundamentally different capability from periodic manual reporting. Where a spreadsheet captures history, a monitoring system captures the present — enabling faster decisions before small issues become costly ones.
How Modern Factory Monitoring Works
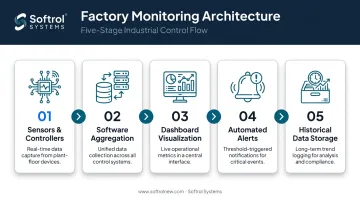
The architecture follows a clear data flow:
- Sensors and controllers capture data at the equipment level — run states, cycle times, utility draws, process parameters
- Software aggregates that data and maps it to assets, shifts, orders, and product types
- Dashboards visualize performance in real time, making issues visible as they occur
- Automated alerts notify the right people when something falls outside acceptable parameters
- Historical data is stored for trend analysis, shift comparisons, and maintenance planning
The scope spans the full production cycle — from raw material input through finished goods output. Depending on the operation's needs and IT preferences, systems can run on-premises, be accessed via cloud, or use both configurations.
That deployment flexibility matters especially in textile services environments, where a single platform needs to surface data from wash aisles, chemical systems, garment sorting, and rail-based material handling simultaneously — rather than requiring managers to consult each system separately.
What Factory Monitoring Covers: Key Areas of Production Visibility
A well-implemented monitoring system covers five distinct operational areas that together build a complete picture of plant performance.
Equipment and Machine Performance
This is the most immediate layer of visibility: is each piece of equipment running, and is it running correctly? Monitoring captures machine uptime, cycle times, run states, and fault conditions in real time.
The practical value is speed of detection. When a dryer line goes down or a washer begins running slow cycles, operators know within minutes — before the throughput gap compounds across an entire shift.
Process and Quality Monitoring
In textile services and industrial laundry environments, process control is as important as equipment uptime. Monitoring at this level tracks:
- Wash formula adherence per load
- Chemical dosing accuracy and delivery verification
- Temperature and flow parameters during processing
- Cycle completion status
Deviations get flagged instantly, preventing an entire batch from being processed incorrectly before anyone notices.
Production Output Tracking
Throughput monitoring compares actual units processed — garments sorted, loads completed, pounds handled — against planned targets in real time. Supervisors can spot a gap during the shift while there's still time to respond, rather than explaining a shortfall after the fact.
Downtime Monitoring and Categorization
There's a significant difference between knowing a machine stopped and knowing why it stopped. Effective monitoring captures:
- Planned maintenance stoppages
- Equipment faults
- Operator absence or changeover
- Material shortage or upstream delays
That categorization makes downtime actionable. Recurring patterns — a specific washer faulting on the same error code, a shift consistently losing time to material shortages — surface clearly and can be addressed directly.
Energy and Resource Consumption Monitoring
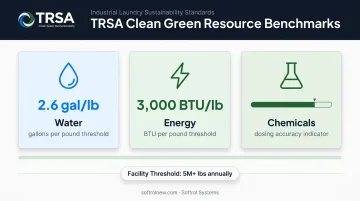
Tracking water, chemical, and power consumption alongside production volume reveals where resources are being used efficiently and where they aren't. TRSA's Clean Green certification criteria set specific resource thresholds for industrial laundry plants — 2.6 gallons per pound and 3,000 BTU per pound for facilities processing more than 5 million pounds annually. Tracking utility-per-pound against those benchmarks gives plant managers a concrete performance target, not just a compliance requirement.
Core Benefits of Implementing a Factory Monitoring System
Real-Time Alerts and Faster Response
When a monitoring system detects an anomaly — a machine fault, a missed production target, a process parameter out of range — it can send automated alerts immediately. The right person learns about the problem in minutes rather than at shift end.
The distinction matters because undetected stoppages compound quickly. A bottleneck machine losing 20 minutes of output early in a shift can cascade into downstream delays that affect the entire day's throughput. Alert speed doesn't automatically fix the problem, but it eliminates the information delay that allows small issues to become large ones.
Softrol's LOIS platform delivers these alerts directly to designated email addresses, meaning plant managers and operations directors receive notifications on any device without needing to be logged into the system or physically present at the facility.
Complete Operational Transparency
Manual reporting fragments information across departments. Maintenance has their records. Production has theirs. Management assembles the picture hours later from reports that may not agree with each other.
A monitoring system replaces that fragmentation with a single source of truth — one live data set that production, maintenance, and management teams all access simultaneously. That shared visibility cuts friction across shift handovers, maintenance scheduling, and production planning — three areas where delayed or conflicting information tends to cost the most time.
Reduced Unplanned Downtime Through Condition Monitoring
Reactive maintenance — fixing equipment after it breaks — is the most expensive maintenance model. Continuous monitoring enables a shift toward condition-based approaches, where warning signs are caught before they cause a full breakdown.
Siemens' 2024 downtime research found that large industrial plants averaged 27 downtime hours per month, with an average recovery time of 81 minutes per incident.
The cost per hour varies by operation, but for a laundry facility the calculation is direct: stopped line throughput in pounds per minute, multiplied by contribution margin, plus idle labor, wasted chemistry, and restart costs. Monitoring shortens the time to awareness; a strong response process then determines how much of that loss is actually recovered.
Improved Labor and Resource Utilization
With accurate production data, managers can identify where workers are underutilized, where scheduling changes would improve shift output, and where bottlenecks are slowing throughput. Softrol's Total Plant Management software tracks all three simultaneously, giving managers the data to act on productivity gaps rather than hunches:
- Operator work rates by shift and station
- Machine utilization against scheduled capacity
- Plant throughput trends across the full production cycle
Multi-Site and Remote Visibility
For operations managing more than one facility, remote access changes the oversight model entirely. Rather than relying on each plant's supervisors to surface problems, an operations director can view live performance data across all locations from a single account.
Softrol's LOIS platform is built for this use case. Managers access live plant data from any smartphone, tablet, or PC through a standard browser. Multiple facilities appear under one account, so an operations director can monitor every location without setting foot on-site.
Key Factory KPIs That Monitoring Systems Track
Overall Equipment Effectiveness (OEE)
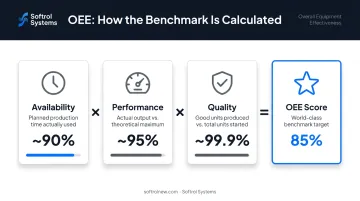
OEE is the product of three factors:
| Factor | What It Measures |
|---|---|
| Availability | Run time as a percentage of planned production time |
| Performance | Actual output rate versus the equipment's rated speed during run time |
| Quality | Good units produced versus total units produced |
Multiply all three and you get a single number that captures every way equipment can underperform. An 85% OEE is a widely referenced benchmark for strong performance (roughly 90% availability × 95% performance × 99.9% quality), though it is a longstanding convention rather than a universal standard.
The more useful approach for any individual plant is to baseline each asset and track improvement from that starting point. That means setting separate baselines for each wash aisle, dryer line, ironer, and garment finishing cell.
Downtime Rate and MTBF
Two complementary metrics:
- Downtime rate: total downtime as a percentage of scheduled production time — the denominator and how planned stops are treated should be defined consistently
- Mean Time Between Failures (MTBF): average operating time between failures for a repairable asset
MTBF is asset-specific. A tunnel washer, an ironer, and a rail conveyor should each have their own tracked MTBF rather than sharing a single plant-wide figure. Trending these over time tells maintenance teams whether their interventions are working.
Production Throughput and Attainment
Throughput attainment compares actual output against planned targets over a shift or period. Consistently missing attainment, even by modest percentages, indicates a chronic capacity problem that deserves systematic investigation rather than reactive adjustment.
Quality Yield and First-Pass Yield
First-pass yield (FPY) measures the percentage of output that completes processing correctly without rework or rejection. In laundry operations, this translates to good pounds processed versus total pounds input, with rewash percentage being the clearest quality metric. Tracking where defects originate enables targeted corrections rather than blanket process changes. Common sources to isolate include:
- Specific machines showing elevated reject rates
- Shift-to-shift variation in processing outcomes
- Product types prone to rework under standard cycles
What to Look for When Choosing a Factory Monitoring System
Real-Time Dashboards and Remote Access
An effective system provides live dashboards accessible from both the plant floor and remotely. For textile services operations — where managers frequently oversee multiple sites or travel between facilities — being dependent on physical presence to understand plant performance is a structural disadvantage.
Softrol's LOIS is designed around this need: browser-based access from any device, available 24/7, with multi-site monitoring from a single account. Operations directors managing networks of laundry facilities across regions can view all locations under one login without switching platforms.
Integration with Existing Plant Controls
A monitoring system delivers its full value when it connects directly with the control systems already managing equipment — wash aisle controllers, chemical dispensing systems, garment sorting automation, and rail-based material handling. When data flows automatically from these sources, managers get a complete and accurate picture without manual entry, which introduces both delay and error.
LOIS integrates natively across Softrol's product ecosystem, so the monitoring layer reflects actual plant conditions rather than manually assembled data:
- AutoPulse wash aisle controls
- Catalyst and ChemPulse chemical systems
- AutoSort garment sorting
- Softrol Rail material handling system
Scalability and Support
Look for a system that grows with the operation — adding machines, production lines, or additional plant locations without requiring a platform replacement. LOIS supports multiple levels of deployment and allows new sites to be brought under the same user account as an operation expands.
Provider support is critical, particularly for operations without large in-house IT teams. Softrol provides 24/7/365 technical support and a CRM-based service ticketing system, with implementation assistance and training included from initial installation onward.
Frequently Asked Questions
What is production monitoring?
Production monitoring is the real-time tracking of manufacturing output, machine performance, and process conditions to ensure production targets are being met. It allows issues to be identified and resolved during active operations rather than discovered after a shift ends.
What is a KPI in a factory?
KPIs (Key Performance Indicators) are measurable metrics used to evaluate operational performance. Common factory KPIs include OEE, downtime rate, production throughput, and quality yield. Monitoring systems track these automatically, supporting data-driven decisions rather than end-of-shift estimates.
What are the five types of monitoring?
The five practical categories are equipment and machine monitoring, process monitoring, quality monitoring, energy and resource monitoring, and environmental monitoring. Factory monitoring platforms often integrate several of these into a single view.
What are the five pillars of condition monitoring?
Five commonly used condition monitoring techniques are vibration analysis, thermal imaging, oil and fluid analysis, ultrasound detection, and visual inspection. Together they provide a broader picture of equipment health to support proactive maintenance strategies.
How does a factory monitoring system help reduce downtime?
Factory monitoring reduces downtime by detecting equipment faults and performance anomalies in real time and alerting operators immediately. Historical data also helps identify recurring failure patterns — enabling maintenance teams to intervene before a fault causes an unplanned stoppage rather than after.